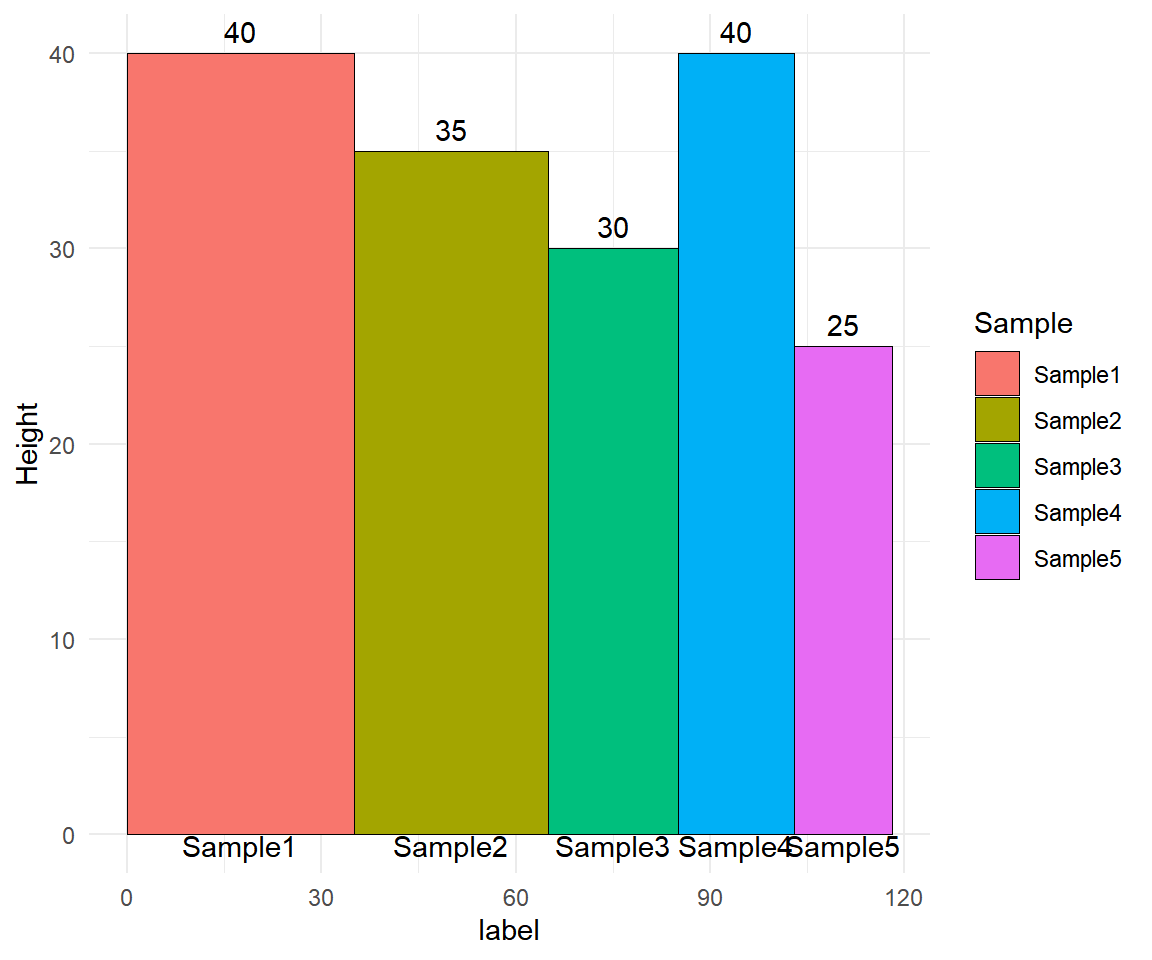
# A tibble: 5 × 3
  Sample  Width Height
  <chr>   <int>  <int>
1 Sample1    35     40
2 Sample2    30     35
3 Sample3    20     30
4 Sample4    18     40
5 Sample5    15     25
R语言如何绘制不等宽柱形图
什么是不等宽柱形图
R 中的 ggplot2 包提供了绘制矩形的函数:geom_rect()。
geom_rect()函数可以根据xmin, xmax,ymin, ymax四个点的坐标绘制四边形,这就为我们绘制不等宽柱形图提供了函数基础。
绘图前的数据准备
包含三列数据:
第1列是柱子的名字
第2列是柱子的宽度
第3列是柱子的高度
demo数据可以从这下载:https://www.r2omics.cn/res/demodata/rect.txt
R语言如何绘制不等宽柱形图
# 代码来源:https://www.r2omics.cn/
library(tidyverse)
# 读取数据
df = read.delim("https://www.r2omics.cn/res/demodata/rect.txt")
# 处理数据
dfPlot = df %>%
mutate(xmax = cumsum(Width)) %>% # xmax为Width列的累加和
mutate(xmin = xmax - Width) %>% # xmin
mutate(label = (xmin + xmax)/2) # label,xmin和xmax的中间位置,用于标记
# 绘图
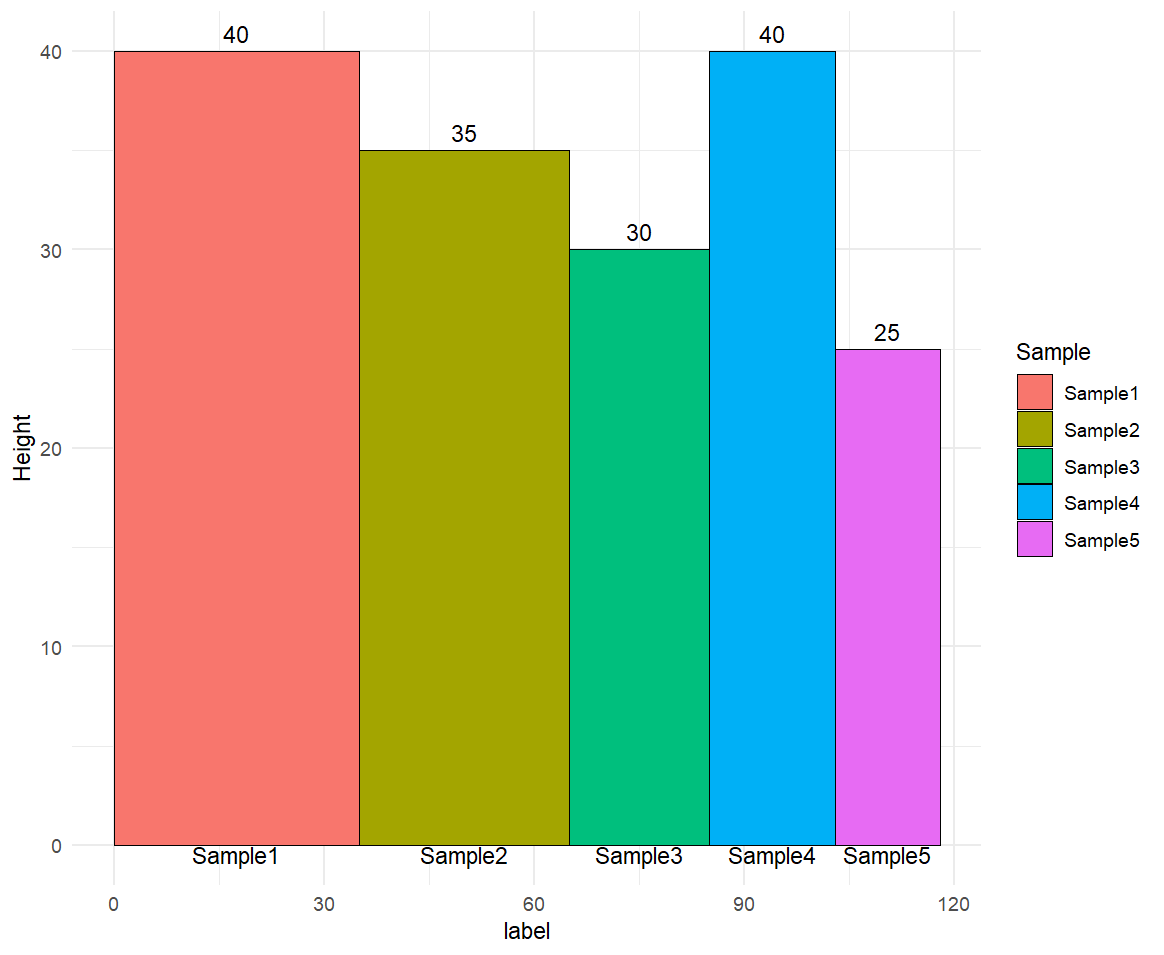
ggplot(dfPlot)+
geom_rect(aes(xmin=xmin,xmax=xmax,ymin=0,ymax=Height,fill=Sample), # 利用geom_rect绘制四边形
colour="black",size=0.25)+ # 给四边形添加了个黑色边框
geom_text(aes(x=label,y=Height,label=Height),vjust=-0.5)+ # 添加数字标签
geom_text(aes(x=label,y=0,label=Sample),vjust=1)+ # 添加下方的文字标签
theme_minimal() # 主题